Getting Started
The anomaly detection module comes with two pre-configured cases. This guide walks through enabling the module, running it for the first time, and understanding the output.
Enable the module
Open your GA4Dataform repository and find includes/custom/modules/anomaly_detection/config.json. This file controls whether the module is active.
{
  "enabled": true,
  "version": 1,
  "cases": ["ga4_events", "ga4_sessions"]
}
If enabled is set to false, change it to true and commit. The module is now active.
What comes pre-configured
Two cases are included by default.
ga4_events monitors event counts by event name. It learns the normal daily volume for each event (purchase, page_view, sign_up, etc.) and flags significant deviations. This catches issues like a broken tag dropping conversion events, or unexpected changes in engagement patterns.
For a series to qualify for model training, it must meet both of the following thresholds within the 90-day training window:
- At least 60 days with recorded data
- An average of at least 20 events per day
Only the top 5 events by total volume are trained. Events that fall below either threshold, or outside the top 5, are excluded. In practice, high-volume events like page_view and session_start will qualify. Low-volume events like custom micro-conversions typically will not, and will produce no anomaly signals.
ga4_sessions monitors session counts by channel grouping (last_non_direct_traffic_source.default_channel_grouping). It tracks organic, paid, direct, referral, and other channels independently, each with its own learned baseline. A sudden drop in organic traffic or an unexpected spike in paid is surfaced immediately.
For a channel to qualify for model training, it must meet both of the following thresholds within the 90-day training window:
- At least 60 days with recorded data
- An average of at least 50 sessions per day
For anomaly detection, a channel must average at least 100 sessions per day; channels below this threshold are scored but marked as unreliable in the output (is_strong_series = false). Unlike ga4_events, this case does not limit training to a top-N subset.
Both cases output results to a single table: anomaly_detection_report.
If the defaults do not fit your property — for example your site is newer, your traffic is lower, or you are seeing too much noise — see Adjust Detection Thresholds for a step-by-step guide.
Run the module
Once enabled, the module runs automatically with every full project refresh. To run it immediately, use Dataform's tag-based execution.
In your Dataform workspace, open Start execution, select Tags, and enter:
module_anomaly_detection
Dataform runs only the actions that belong to this module. With the two default cases, that produces seven actions in total.
| Action | Type | Destination dataset |
|---|---|---|
int_anomaly_detection_{case}_time_series | Table | TRANSFORMATIONS_DATASET |
int_anomaly_detection_{case}_model_training | BigQuery ML model | TRANSFORMATIONS_DATASET |
int_anomaly_detection_{case}_anomalies | Table | TRANSFORMATIONS_DATASET |
anomaly_detection_report | Table | OUTPUTS_DATASET |
Each action performs a distinct step in the pipeline:
int_anomaly_detection_{case}_time_series: aggregates your GA4 data into a daily time series, one row per date and dimension combination (e.g., one row perevent_nameper day). Ifmetric_capis configured, the metric is capped at that value before the table is written.int_anomaly_detection_{case}_model_training: trains a BigQuery ML ARIMA_PLUS model on the time series. This is the longest step on first run.int_anomaly_detection_{case}_anomalies: scores recent data against the trained model and identifies points that fall outside the predicted bounds.anomaly_detection_report: combines training rows and scored detection rows into a single output table.
On the first execution, the model trains from scratch. Detection results will not appear until training completes and the pipeline has scored at least one detection window. Subsequent runs reuse the trained model and append new scored results unless the model cron triggers a full retrain.
Output table
The anomaly_detection_report table is the single output you query and connect to reporting tools. It is partitioned by date and clustered by case_name and time_series_id.
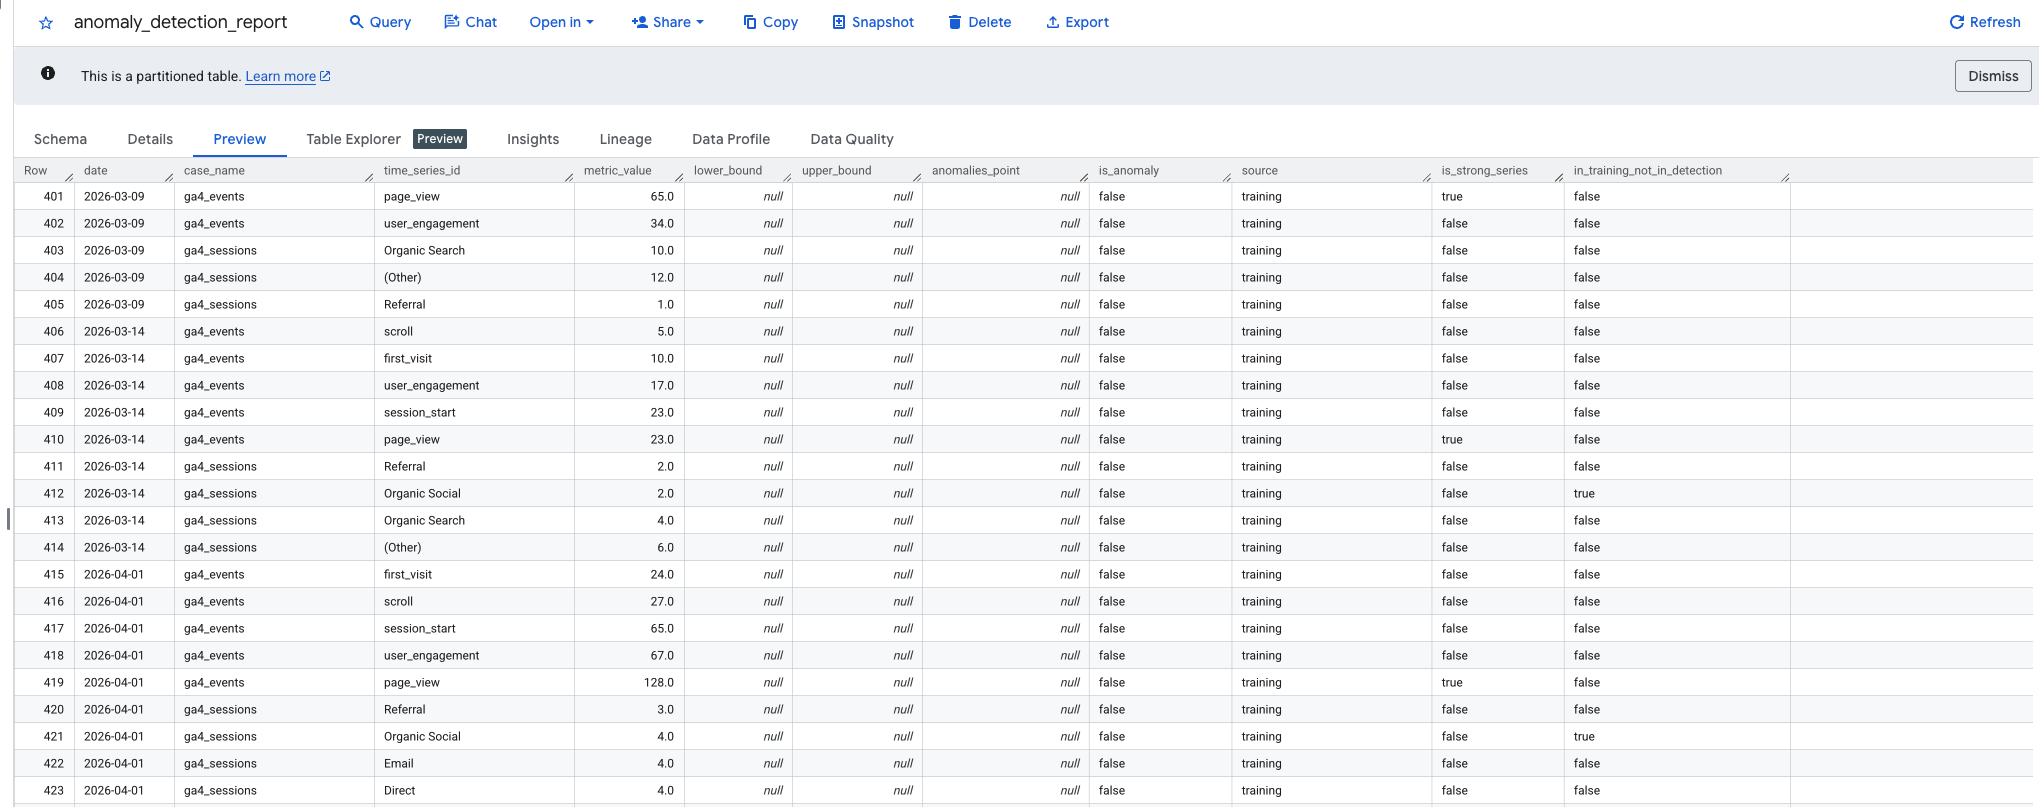
The table contains two types of rows, identified by the source column.
source = 'training' rows represent the historical baseline data used to train the model. They carry a date and a metric value but no bounds and no anomaly flag. Their purpose is context: they allow you to visualize the training window alongside detection results in a single query or dashboard.
source = 'anomaly_detection' rows are the scored results. These carry lower_bound, upper_bound, an is_anomaly flag, and an anomalies_point value. This is where actual anomaly signals appear.
Key columns to know:
is_anomaly:truewhen the metric value falls outside the model's predicted bounds for the series during the detection window.anomalies_point: carries the metric value only whenis_anomaly = true; null otherwise. Useful for plotting anomaly markers without filtering.is_strong_series:truewhen the series met the minimum quality thresholds for detection.in_training_not_in_detection:truewhen a series was present during training but produced no data during the detection window. Worth investigating: it may indicate a tracking change, a dropped channel, or traffic that fell below the detection threshold.
For a full column reference, see the Output Data Dictionary. To query the table with ready-made SQL, see the Query Library. To explore results in Looker Studio, see The Looker Studio Template.