Anomaly Detection Overview
This module is available exclusively for Premium users.
The Anomaly Detection module watches a time series of metrics and dimensions you define and flags changes that fall outside what is historically normal.
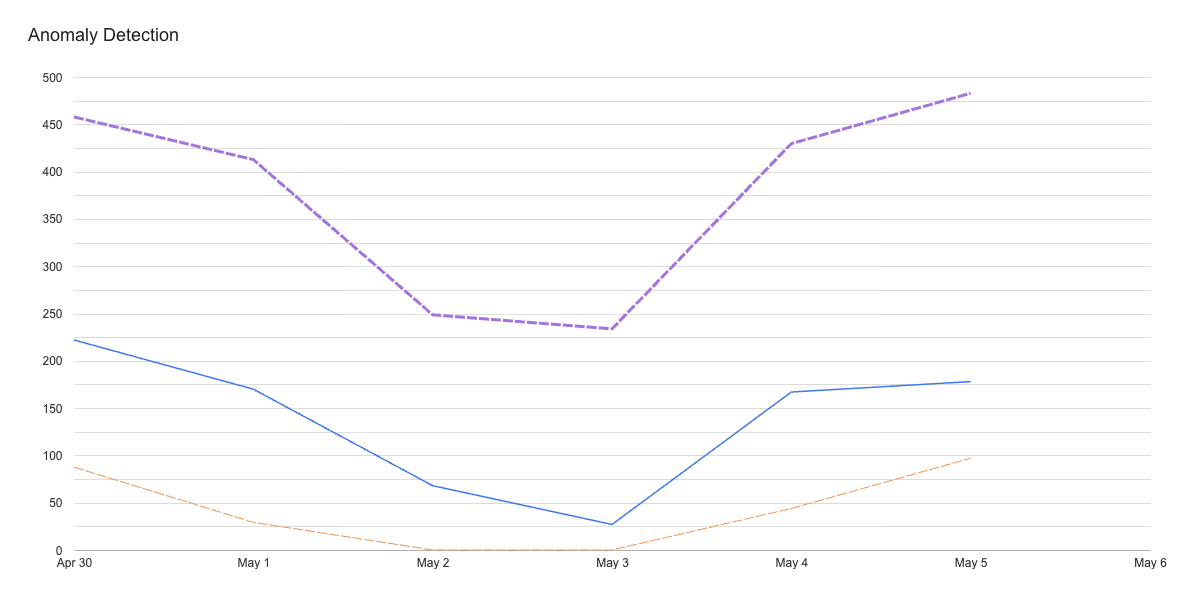
Why do we need Anomaly Detection?
A spike in page views? A drop in conversion rate? A disappearance of add-to-cart events? Anyone in charge of analytics has attended a meeting where a chart gets questioned and no one can explain it. As an analyst or engineer, you feel useless; on the business side, you feel helpless. Everyone gets frustrated. Analytics data can go off in many directions for technical and business reasons: a third-party app update, a marketing campaign with a misconfiguration, tracking issues, content going viral, a new product suddenly gaining traction, etc. Depending on how the data is segmented, issues can remain invisible for a long time and suddenly appear at the worst moment. The immediate consequence is that the next few hours or days are spent investigating and fixing. The second is that something that seemed unimportant now gets attention and drives priorities. Fixing the issue or being able to explain it is only part of the solution. If you can detect anomalies before a meeting happens, before you get that email or Slack message, that is when you can shift the discussion. Being able to detect trends in your data at scale puts you in a much better position of control. You can organize your resources to prioritize investigations, fix issues, and set the meeting agenda.
How it works?
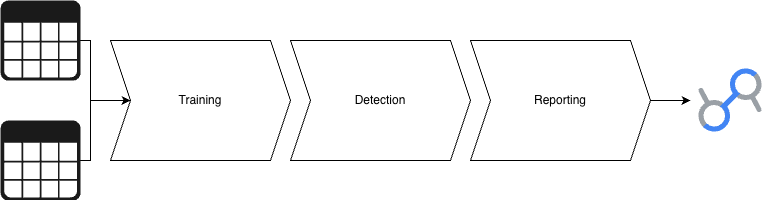
The module is built on top of GA4Dataform output tables by default, but can be connected to any BigQuery table. It trains a statistical model on historical data using ARIMA, then uses that model to flag anomalies. The pipeline runs daily. Each day, recent metric values are compared against a baseline learned from the previous 90 days by default. Two cases come pre-configured: ga4_events, which monitors event counts by event name, and ga4_sessions, which monitors session counts by channel. All results flow into a single output table: anomaly_detection_report.
How to read this documentation?
This documentation is organised into four parts.
Guides is the best place to start once the module is running. It explains how to read the Looker Studio template, explore the output table directly in BigQuery, and decide when a flagged result warrants an alert.
How-To is where to go when you want to make a change: enabling the module for the first time, customising default cases, adjusting detection thresholds, or adding a new case.
Reference covers the full list of configurable variables, the output table schema, ready-made SQL queries, and the helper functions available for custom cases.
Architecture & Concepts goes one level deeper, for anyone wanting to understand how the detection pipeline works, what distinguishes an anomaly from an alert, or how BigQuery ML handles the modelling.