Explore the Output Table
The anomaly_detection_report table is the single output of the anomaly detection pipeline. You can open it directly in BigQuery at any time to inspect what the module has produced.
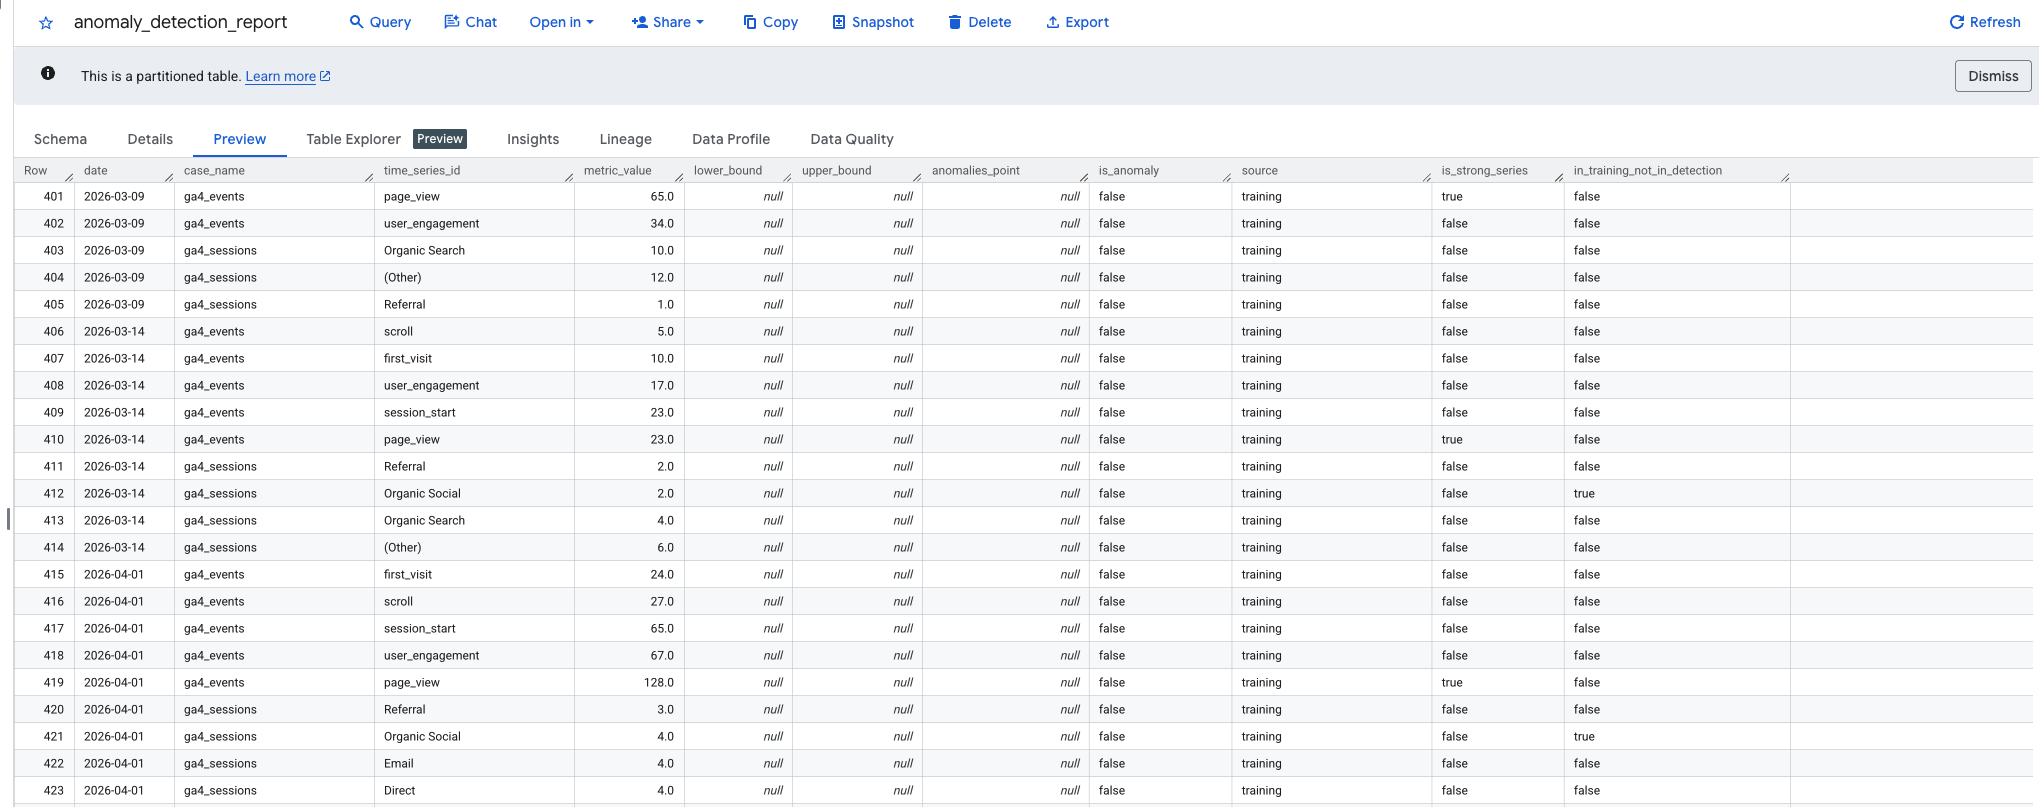
What you are looking at
The Preview tab shows raw rows from the table. At first glance, most rows will look sparse: bounds are null, anomalies are false, and everything is labeled training. This is expected. The table combines two very different types of rows in the same output, identified by the source column.
The two row types
source = 'training' rows represent the historical baseline data fed to the model. They carry a date, a metric value, and dimension columns, but no bounds and no anomaly flag. Their purpose is context: they let you visualize the training window alongside the detection window in a single query or dashboard.
source = 'anomaly_detection' rows are the scored results. These carry lower and upper bounds, an is_anomaly flag, and an anomalies_point value. This is where actual anomaly signals appear.
When you open the table preview, you will typically see training rows first because the table is partitioned by date and training data covers a longer historical range. To see detection results, filter by source = 'anomaly_detection' or sort by date descending.
Reading is_strong_series
The is_strong_series column tells you whether a series met the minimum quality thresholds for reliable detection. In the preview above, page_view rows show true while scroll, first_visit, and user_engagement show false.
A false value does not mean the series is broken. It means it does not have enough history or volume to produce trustworthy signals. When building alert logic, restrict to is_strong_series = true to avoid noise from low-traffic series.
Reading in_training_not_in_detection
A true value here means the series was present during training but produced no data during the detection window. The pipeline synthesizes a placeholder row for these series so they do not silently disappear from the output.
In the preview above, Organic Social in ga4_sessions carries this flag. This is worth investigating: it may mean the channel stopped receiving traffic, a tracking change removed the attribution label, or the series simply fell below the detection quality thresholds.
What null bounds mean
Null values in lower_bound and upper_bound appear in two situations:
- The row is a training row (
source = 'training'): bounds are never computed for training data. - The series did not meet detection quality thresholds (
detection_min_series_daysordetection_min_series_avg), so the model has no reliable baseline to score against.
In both cases, is_anomaly will be false and anomalies_point will be null.
Next steps
- To query anomaly results with ready-made SQL, see the Query Library.
- To explore results through the Looker Studio template, see The Looker Studio Template.
- For a full column reference, see the Output Data Dictionary.