Items tables
This feature is exclusive for Premium users
For ecommerce properties, there is is now a module that can be enabled named items_funnel_report
When enabled, this module outputs 2 tables
ga4_items_sessionsthis is a raw-ish table consisting of 1 row per item per sessions, with aggregate metricsreport_items_funnelthis is a condensed version of the items_sessions table, aggregated by day, optionally including drilldowns on the session level. It can be used as a reporting table in Looker Studio (or BI tool of choice)
Configuration
The config file can be found at includes/custom/modules/items_funnel_report/config.json
The format should be valid JSON. The default is found below:
{
    "version": 1,
    "enabled": false,

    "drilldowns": {
        "channel_group": true,
        "device_category": false,
        "is_new_session": false
    },

    "itemDrilldowns": {
        "item_id": true,
        "item_name": true,
        "item_brand": true,
        "item_variant": true,
        "item_category": true,
        "item_category2": true,
        "item_category3": true,
        "item_category4": true,
        "item_category5": true,
        "affiliation": true
    },

    "itemParamsCustom": [],
    "sessionDimensions": []
}
How to enable
When the key enabled is set to true, the output tables will build (using incremental logic)
After setting this value to true and tweaking other config options, you should commit → push → and the next compiled workflow will build the items table (using the GA4_START_DATE as starting date).
Configuring the options
version - this describes the version number of the config file. The latest version is 1 - so use that.
drilldowns is an object with several pre-defined “toggles” of custom dimensions that can be enabled or disabled.
- channel_group - this will add the
last_non_direct_traffic_source.default_channel_groupingcolumn to the reporting table - device_category - this will add a column
device_categoryto the output table (desktop, mobile, tablet, smart tv) - is_new_session - this will use
ga_session_number = 1logic to the reporting table, so you can drill down/segment on new users
itemsDrilldowns is an object where you can toggle the standard item dimensions on or off.
Supported toggles:
- item_id
- item_name
- item_brand
- item_variant
- item_category
- item_category2
- item_category3
- item_category4
- item_category5
- affiliation
We recommend disabling item dimensions that are not filled consistently,or else they will “break” the funnel when drilling down.
This is often the case when view_item_list has no item_variant , but add_to_cart has.
itemParamsCustom is an array of strings with names of the custom item parameter definitions you have configured.
Example:
"itemParamsCustom": [ "size", "colour" ],
This works if your includes/custom/config.js has item params with these output names configured.
Note: use the output names (used in renameTo)
  CUSTOM_ITEM_PARAMS_ARRAY: [
      { name: "size", type: "string" },
      { name: "color", type: "string", renameTo: "colour" }
   ]
sessionDimensions is an array of OBJECTS that contain optional other session dimension drilldowns.
The column name objects have the following keys
name- valid column names as they appear in thega4_sessionstablerenameTo- optional - the name they will get in the items output table. If this is not used, a sanitised verion ofnamewill be used
Example:
"sessionDimensions": [
  { "name": "last_non_direct_traffic_source.campaign", "renameTo": "campaign_name" },
  { "name": "session_params_custom.customer_type", "renameTo": "customer_type" }
]
Output tables
ga4_items_sessions
This table is a minimal table, containing
session_date(partitioning column)property_idplatformis_final(used for incremental building)item(a singe item, flattened containing all dimensions and custom params)item_totals(a struct containing event counts for every ecommerce event)- add_payment_info
- add_shipping_info
- .. etc (for every ecommerce event)
- purchase_quantity
- item_revenue
report_items_funnel
This table is smaller (row-wise) and a bit wider. It contains daily aggregates based on session_date and your choice of dimensions you add:
session_date(partitioning column)item- a singe item, flattened containing the chosen drilldowns and optional custom paramsproperty_idplatformis_final(used for incremental building)item_totals- a struct with 3 types of metric aggegatesevents(based on event counts)- add_payment_info
- add_shipping_info
- .. etc (for every ecommerce event)
sessions(based on session counts)- add_payment_info
- add_shipping_info
- .. etc (for every ecommerce event)
users(based on user_pseudo_id)- add_payment_info
- add_shipping_info
- .. etc (for every ecommerce event)
purchase_quantity(sum)item_revenue(sum)
your chosen session dimensions- depending onthe chosen drilldowns and custom dims
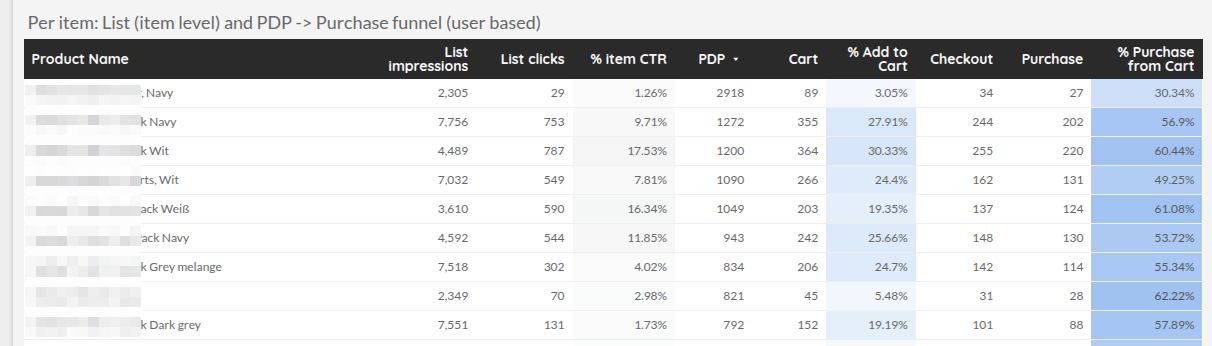
Sample reporting table
When connecting the report_items_funnel table, it’s pretty simple to connect it to a BI tool and create a table and calculate metrics
Sample metrics, assuming there is an item_name in the row:
sum(item_totals.events.add_to_cart)= total times the item has been added to cartsum(item_totals.sessions.purchase)= total sessions where this item has been purchasedsum(item_totals.users.purchase) / sum(item_totals.users.view_item)= user based purchase-to-detail rate