Conversion Rate per Event Report Module
This feature is exclusive for Premium users!
The Conversion Rate per Event Report module enables you to calculate conversion rates for any event in your GA4 data, going far beyond the limited conversion rate reporting available in the GA4 interface.
The loveliest metric in Google Analytics (and web analytics in general) is conversion rate. We all want a higher conversion rate! But GA4's native conversion rate reporting is limited to session-scoped dimensions only. This module unlocks conversion rate analysis for every single event.
Understanding Conversion Rates
Let's break it down like a true analyst:
- A conversion is an event that happens - usually a special one where you've persuaded your customer to do something valuable for your business
- A conversion rate is calculated as "number of conversions" divided by "total number", where "number" traditionally means "sessions"
Example: With 500 total sessions and 20 purchases, your conversion rate is 20 ÷ 500 = 4%
How GA4's Native Reporting Falls Short
In GA4, you can only calculate conversion rates for session-scoped dimensions:
- Landing page conversion rates ✅
- Device category conversion rates ✅
- Campaign conversion rates ✅
But what about:
- Conversion rate after viewing a specific product? ❌
- Conversion rate after downloading a file? ❌
- Conversion rate after watching a video? ❌
For these insights, you'd need to resort to segments or custom funnel reports - until now.
GA4Dataform Solution: Conversion Rate for ANY Event
This module creates a reporting table that calculates conversion rates for every event in your GA4 data by constructing "micro-funnels" automatically.
How It Works
- Define conversions: Specify which events count as conversions (e.g.,
purchase,generate_lead) - Set drilldowns: Choose dimensions for analysis (Campaign, Device, User Type, etc.)
- Automatic calculation: The module does the rest
The Magic Behind the Scenes
For each event, we calculate:
Denominator (total sessions): How many sessions included this event
page_view: 500 sessionssubmit_form: 10 sessions
Numerator (conversions): How many sessions had a conversion after this event
- After
page_view: 20 sessions withpurchase, 50 sessions withgenerate_lead - After
submit_form: 2 sessions withpurchase, 8 sessions withgenerate_lead
This creates conversion rate insights like:
- 4% of sessions convert to purchase after viewing a page
- 20% of sessions convert to purchase after submitting a form
Configuration
The module uses a single configuration file: includes/custom/modules/cvr_per_event/config.json
Essential Settings
| Setting | Description | Example |
|---|---|---|
enabled | Enable/disable the module | true or false |
version | Configuration version for tracking changes (set by Superform Labs team) | 1 |
Conversion Events
"conversionEvents": [
    "purchase",
    "generate_lead",
    "showroom_appointment_made"
]
Add any event name you want to track as a conversion. These will appear in the output table under the conversions struct.
Event Filtering
"eventsToExclude": [
    "webvitals_%",
    "javascript_error",
    "click"
]
Exclude technical or irrelevant events from conversion rate calculations. Supports SQL-style wildcards (%) for pattern matching.
Built-in Drilldowns
Toggle common dimensions on/off:
"drilldowns": {
    "default_channel_grouping": true,
    "is_new_session": true,
    "device_category": true,
    "source": false,
    "medium": false,
    "campaign": false,
    "source_medium": false
}
Custom Session Dimensions
Add any column from the ga4_sessions table:
"sessionDimensions": [
    { "name": "geo.country" },
    { "name": "device.operating_system", "renameTo": "os" }
]
name: Exact column name fromga4_sessionstablerenameTo: Optional renamed column in output (auto-renamed if omitted)
Output Table Structure
Granularity: Daily aggregates by event and configured dimensions
The module creates report_cvr_per_event in your outputs dataset with these key columns:
| Column | Description |
|---|---|
event_date | The date when the event was logged (partitioning column for performance optimization) |
event_name | The name of the trigger event for which conversion rates are being calculated |
sessions | The number of unique sessions where the trigger event occurred |
is_final | Indicates if the data is final or subject to change (based on 72h window) |
| Conversion Metrics | |
conversions.{event_name} | Struct containing conversion counts for each configured conversion event - shows sessions that had the conversion event occur after the trigger event within the same session (dynamically generated based on conversionEvents config) |
| Built-in Drilldowns (conditionally included) | |
default_channel_grouping | Default channel grouping for traffic attribution (last_non_direct_traffic_source.default_channel_grouping - included if drilldowns.default_channel_grouping = true) |
is_new_session | Boolean indicating if this was the user's first session (ga_session_number = 1) (included if drilldowns.is_new_session = true) |
device_category | Device category (Desktop, Mobile, Tablet) used for the session (included if drilldowns.device_category = true) |
source | Traffic source (last_non_direct_traffic_source.source - included if drilldowns.source = true) |
medium | Traffic medium (last_non_direct_traffic_source.medium - included if drilldowns.medium = true) |
campaign | Campaign name (last_non_direct_traffic_source.campaign - included if drilldowns.campaign = true) |
source_medium | Combined source/medium (included if drilldowns.source_medium = true) |
| Custom Session Dimensions (dynamically added) | |
{custom_dimension_name} | Additional dimensions from ga4_sessions table as specified in sessionDimensions configuration array - column names determined by renameTo value or auto-sanitized from original field name |
The table schema adapts based on your configuration:
- Conversion columns: One
conversions.{event_name}field for each event listed inconversionEventsarray - Drilldown columns: Only enabled drilldown dimensions appear in the table
- Custom dimensions: Additional columns based on
sessionDimensionsconfiguration
Looker Studio Template + Visualization Examples
We created a free-to-use Looker Studio template that was specifically designed to work with the GA4Dataform modules. Feel free to copy it and adapt it to your needs! You can find it here.
Here's a sample use case:

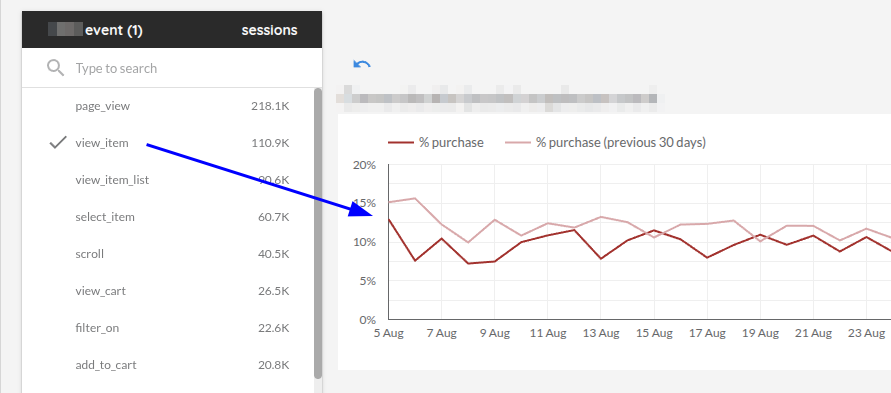
- pick an event (view_item)
- you can see that the purchase rate after view_item is about 10% over time
- if you activate drilldowns - you can break the conversion rate up by Channel Group, Operating System, New vs Returning session, etc.
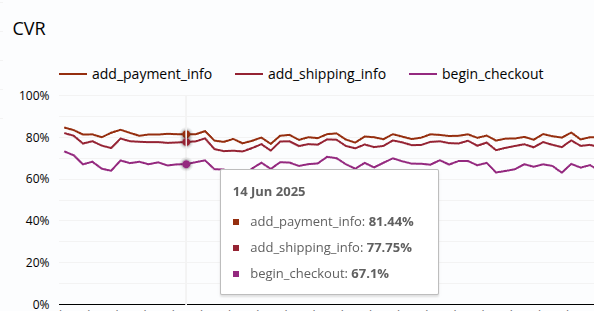
If you’re creative in Looker Studio, you can easily make a trended funnel report by plotting the purchase rates for all checkout steps in one plot:

Important Considerations
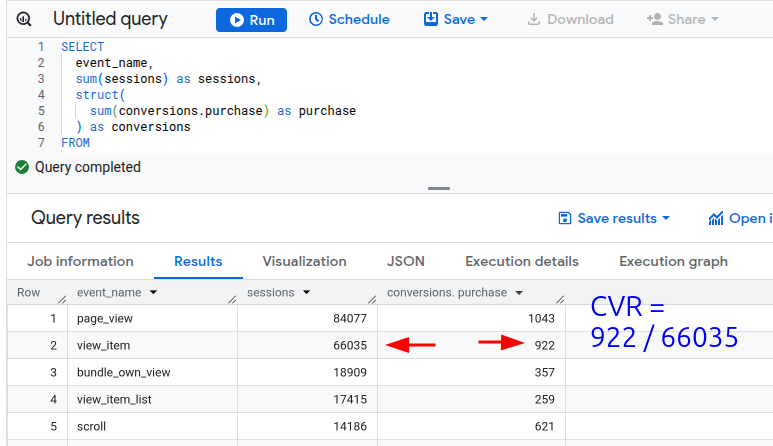
The conversion rate calculation will only be correct when filtered to one single event_name. Make sure your visualizations plot one line or row per event, otherwise results won't be summable.
Example:

Common Use Cases
- E-commerce Funnel Analysis: Track conversion rates from product views to purchases
- Feature Adoption: Analyze which product features lead to upgrades
- User Experience Optimization: Identify high-converting user flows